Enhancing Power Generation with Digital Twin — Web 3D Visualize Fossil Fuel Power Station
From 1885, since the first modern turbine first turned on its wheels, the world has seen new light. Even today, over 50% of the world’s energy is generated by conventional thermal power plants. But now, we are at the threshold of change. Experiencing headwinds from customers, regulatory authorities, and competition from unexpected sources. The Paris Agreement has thrown light on polluting emissions that need to go down. And maintain costs need to be controlled. Workforce is ageing, taking away their years of experience, and there is a need to capture their tacit knowledge.
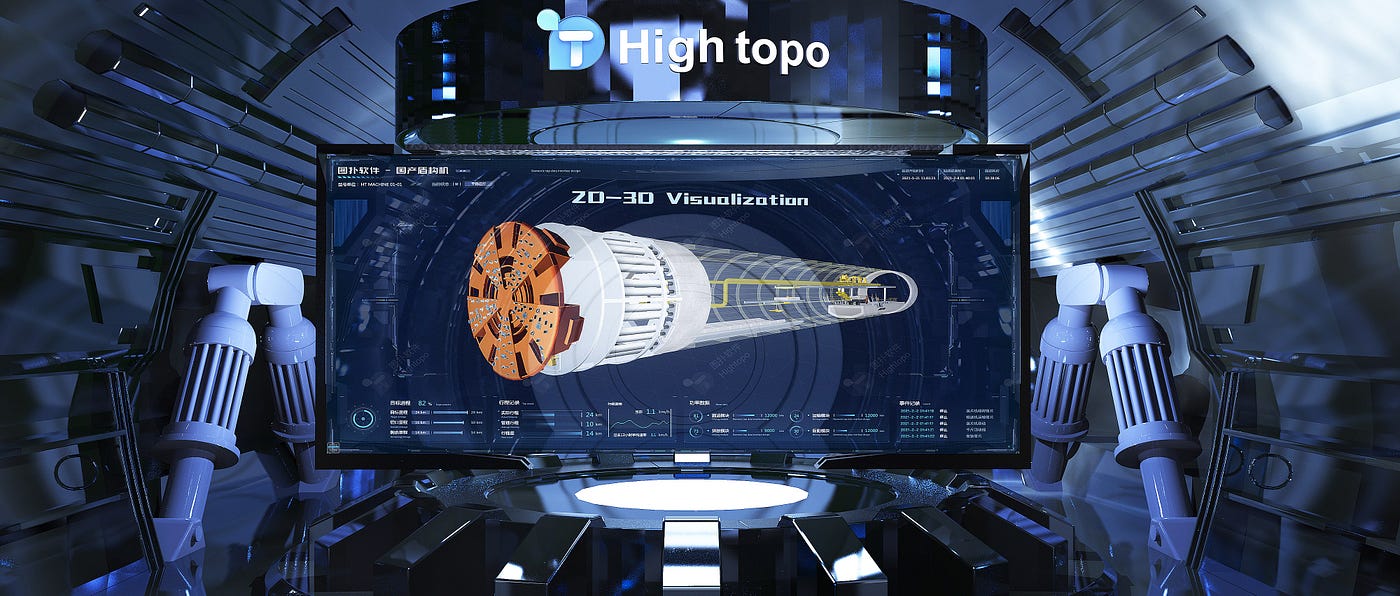
As the reins of power, move from old to new. It's time to go digital! It’s time for fossil-based thermal plants to embrace flexibility, reliability & higher efficiency ways of operation and maintenance. Hightopo brings the powerful web 3d visualization technology into the energy industry, helping thermal plants making smooth sailing of digital transformation journey.
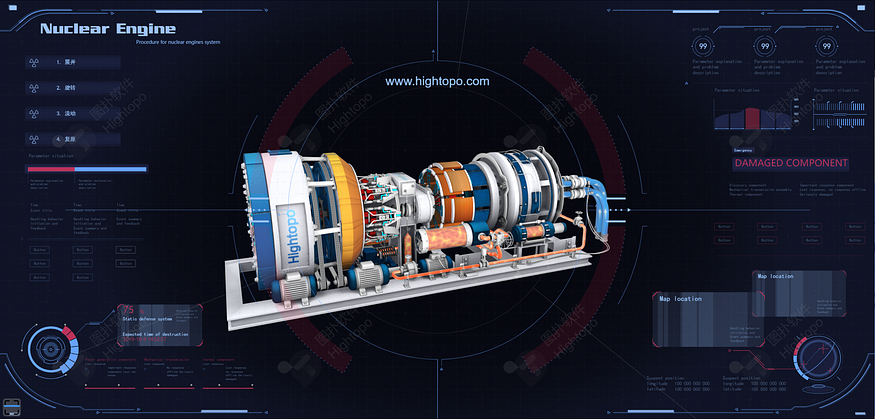
Web Lightweight 3D Model
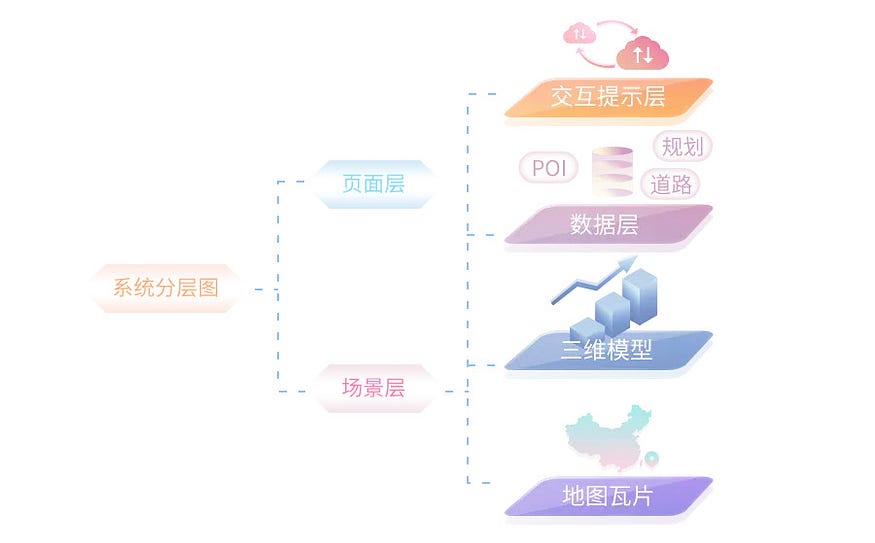
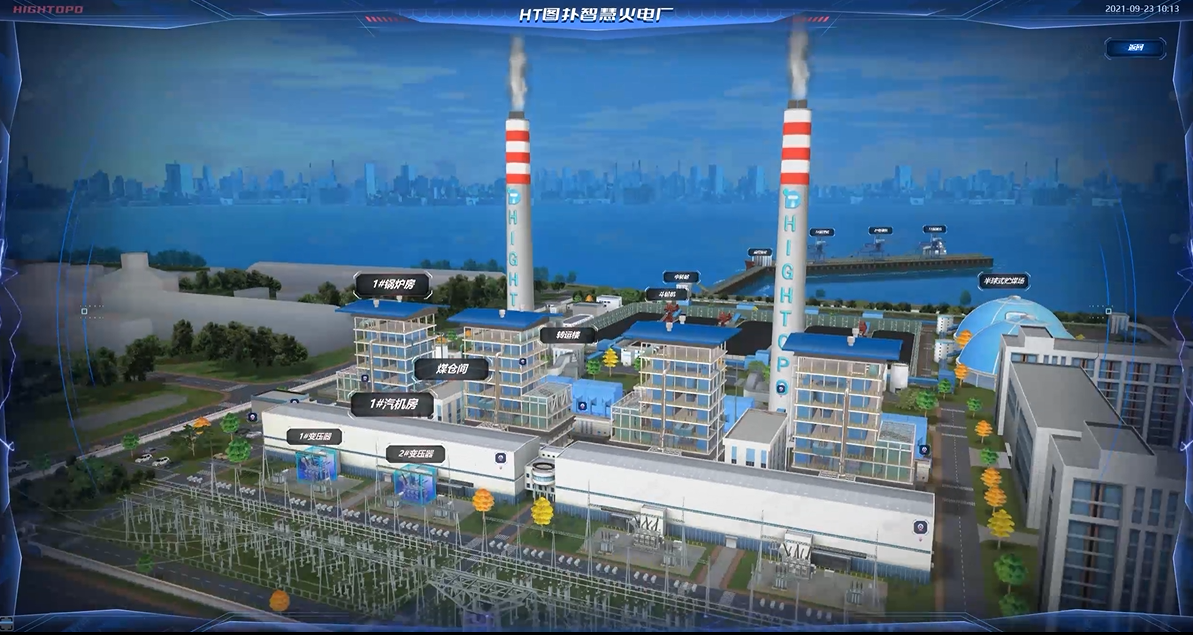
HT supports multiple formates of model rendering, adopts lightweight 3D modelling technology, photorealistic rendering, presents a high-precision simulation of the thermal power plant. Interactive 3D scenes can be zoomed, panned, and rotated, and each model can respond to interactive events.
HT also supports importing BIM model files in IFC format to generate scenes, Furthermore, oblique photography model files in 3D Tiles format is also supported.
Hightopo 3D visualization technology adopts B/S architecture. Users can access the 3D visualization system anytime and anywhere through PC, Tablet or smartphone from a modern browser. Built on the foundation of Digital Twin and powered by data-driven models, Hightopo delivers Flexibility, Reliability & higher efficiency.
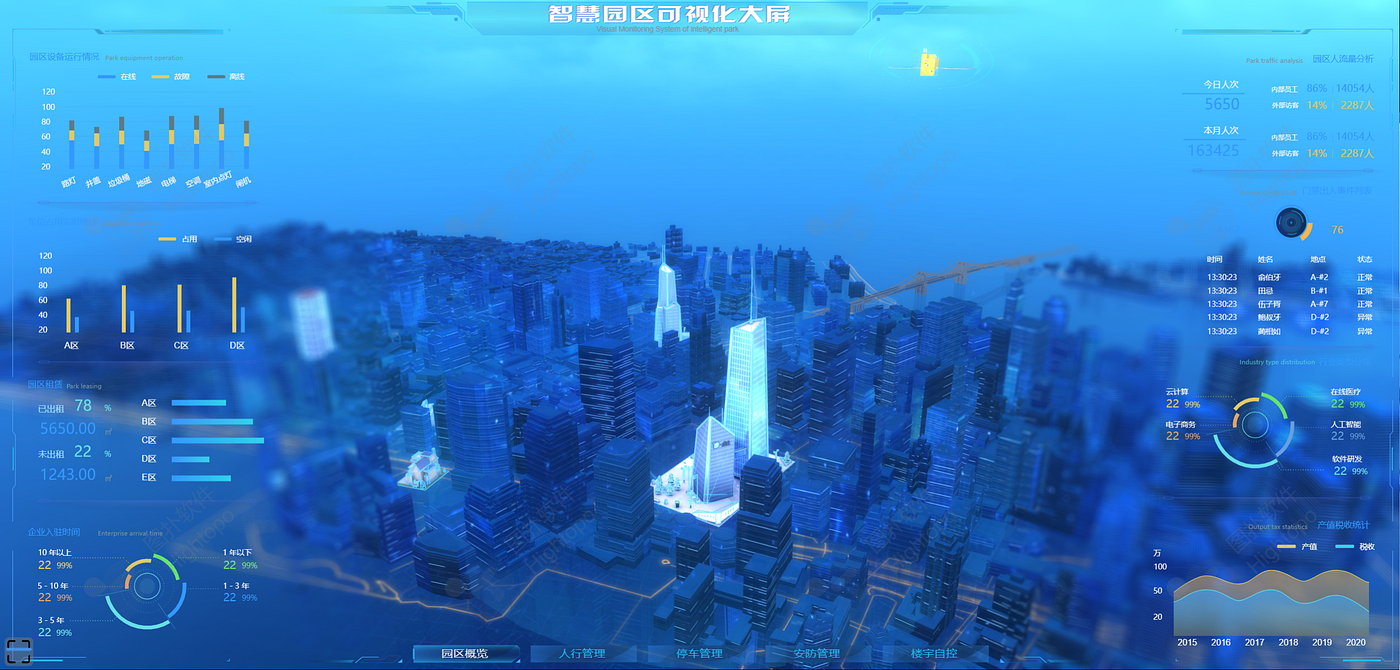
Data Visualization & 3D Flythrough
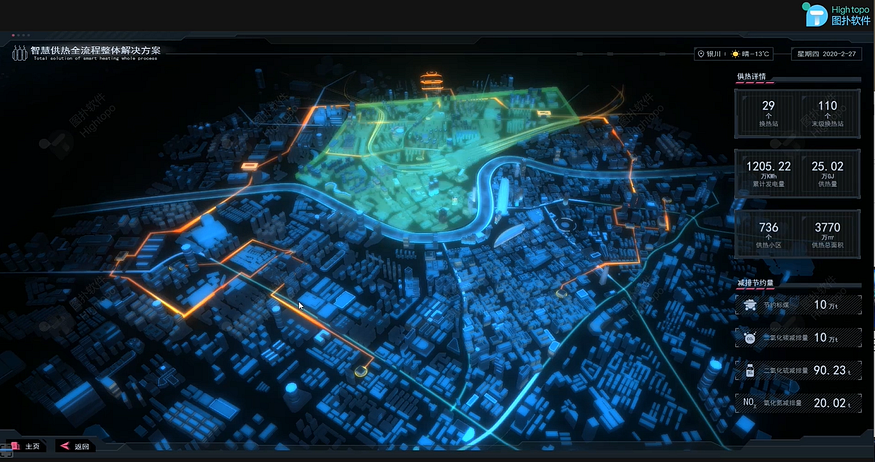
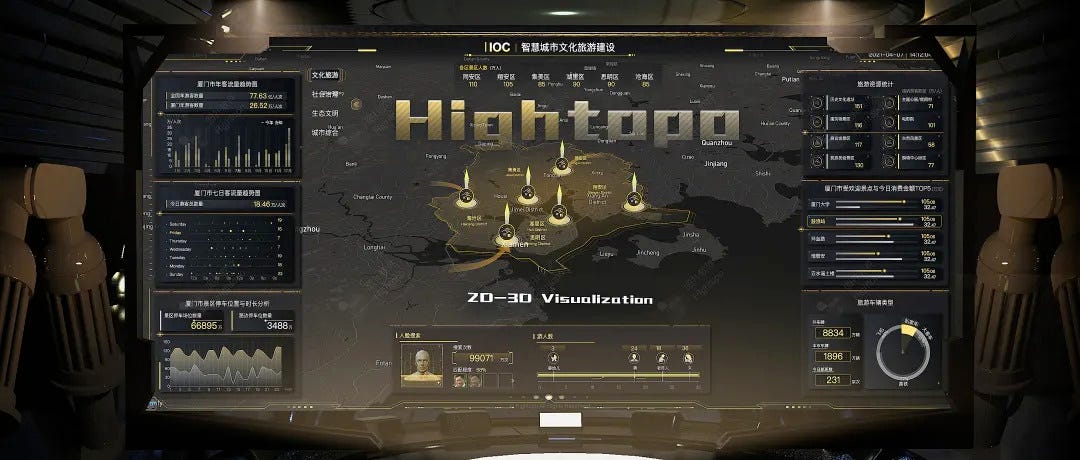
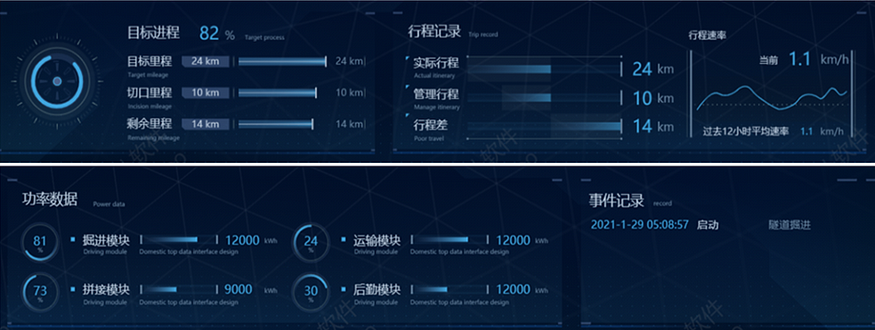
The data panel on the left side indicates power plant information, includes plant information such as location, asset info, and the monthly cost, revenue, and profit analysis chart.
The right side panel shows real-time equipment operation data, production data, emission. Empower plant manager and operation staff to get accurate insight.
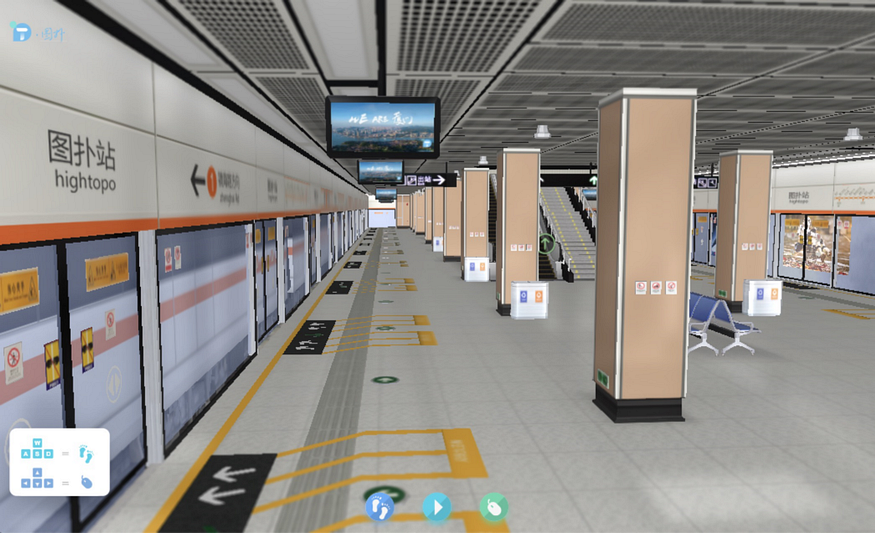
3d flythrough & walkthrough
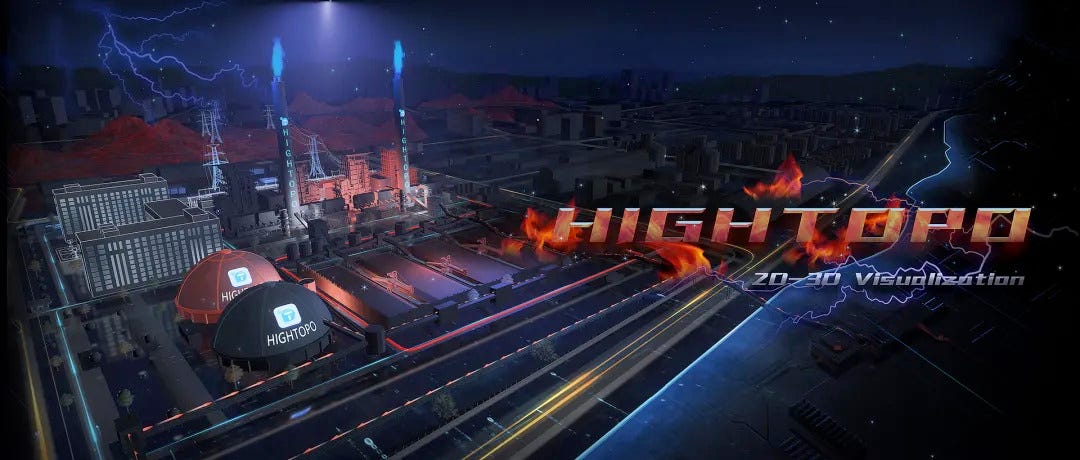
Hightopo powerful 3d rendering enables the smooth 3d flythrough or walkthrough of the scenes. Empower users with an immersive experience to overview the thermal plant.
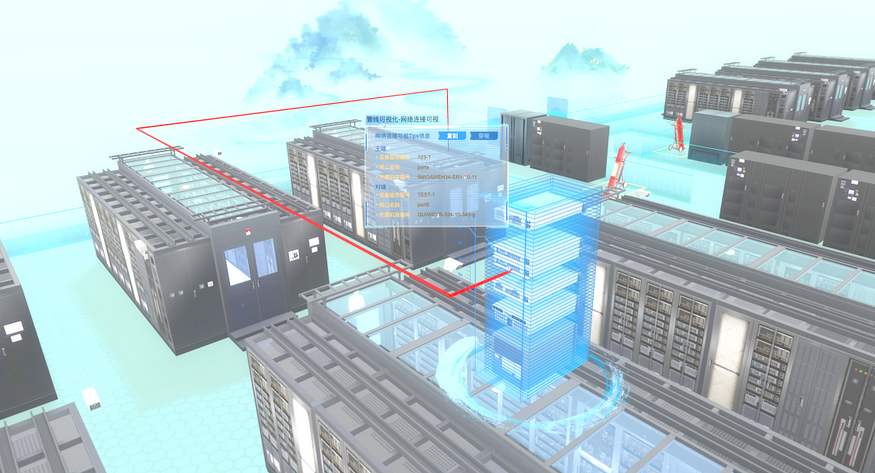
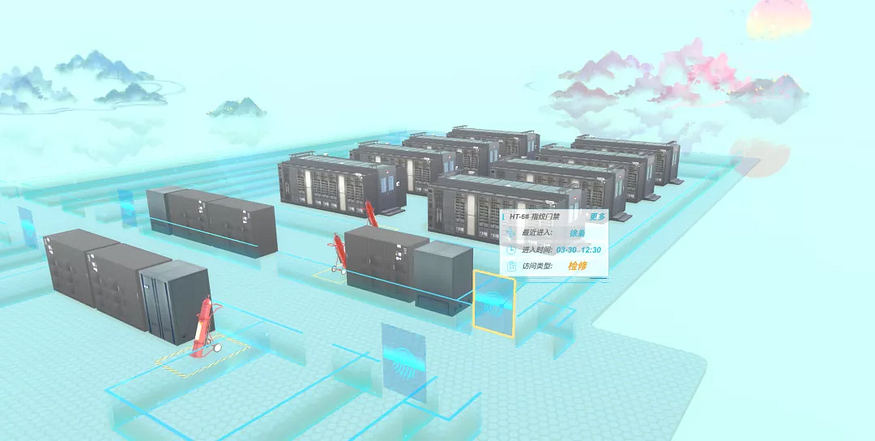
Positioning Tracking & Electronic fence
Ultra-wideband (UWB) is a short-range radio technology which is used for indoor/outdoor positioning. The object to be tracked (asset/person) is equipped with a small tag ( UWB Tag) that sends data (ID, ToF, timestamp) to the receiver. The receiver has a fixed position in the infrastructure and can use the running time of light to calculate the distance of the asset. Implement the UWB system to HT data visualization solution, real-time location of tracking worker can be shown on 3d scene, managers can monitor the location of workers and intuitively view data such as worker information, contact information, and action trajectory. Workers also can use the UWB Tag to send SOS signals when a dangerous situation is encountered, the information will be fed back to the alarm record of the security interface immediately, and the staff of the centralized control centre can respond as soon as they receive the call for help.

electronic fence
In a conventional fossil fuel power station, electronic fences generally appear in highly dangerous areas such as steam turbines, transformers, and booster stations; When an object venturing into these certain areas will trigger alerts to operation & management staff, who will then respond. Combine with Position Tracking technology, this feature will greatly ensure the safety of the staff.
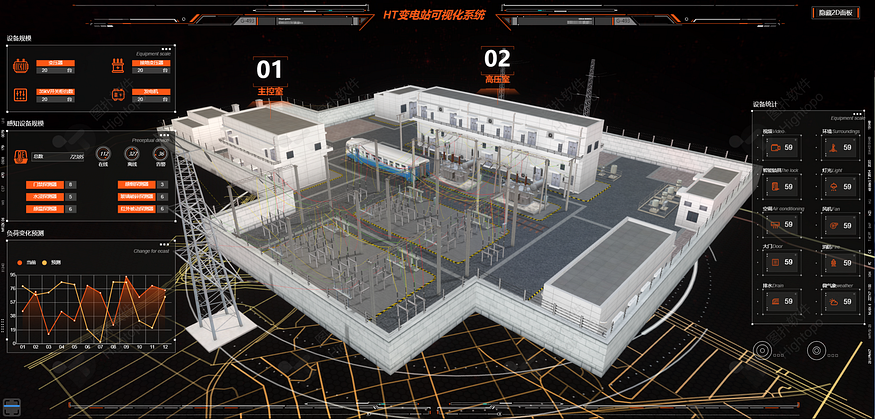
Surveillance Video Integration & Video Fusion

Surveillance cameras located among the plant, the photorealistic 3d scene indicated these cameras with an eye-catching icon. The simple click interaction on the icon will then popup the real-time or historical surveillance footage. With a more advanced facial-recognition camera, the system is able to capture workers rule-breaking behaviour and log into system.
Compared with the traditional monitoring system, the interface of the 3D scene is more intuitive and simple, which is convenient for the monitoring staff to identify abnormal information and improve monitoring efficiency. Enable the capability of quickly locate cameras and better maintenance.
Power Generation Process
Fossil fuel power plants burn coal or oil to create heat which is in turn used to generate steam to drive turbines which generate electricity.
The burning of coal or oil heats giant boilers filled with water. This transforms liquid water into steam. The steam creates a lot of pressure in the boiler. The pressure rotates a steam turbine. This drives a generator to produce electricity. The rotation of the turbine drives a generator. It is the generator that produces electricity.

Generators are devices that convert mechanical energy into electrical energy. First, pressure from heated air makes a rotor turn. A rotor is a shaft found in the centre of the generator. The rotor connects to a coil of wire. The wire spins inside a fixed magnet around it called the stator. The magnetic field pushes electrons along the wire. This forms an electric current then goes to transmission lines.
Embrace the advanced Industry 4.0, IoT technology, with data source from equipment sensors and then fed back to HT data visualization tool, a smart power generation monitoring system can be formed. In-depth development and application of smart power generation control technology to enhance the comprehensive capabilities of power generation companies in smart management and control, smart operation, smart safety monitoring, smart analysis and remote diagnosis, and build a future-oriented innovative management and operation model for smart coal-fired power generation.
Conclusion
With the increasing share of renewables, power plants are forced to operate at part-load conditions. An ageing workforce, concerns over asset reliability and operational costs provide a prerogative to adopt Digital solutions in order to stay competitive. For conventional thermal power plants, this is an era in urgent need of digital transformation.
Hightopo — HT for web, brings cutting-edge data visualization to provide a comprehensive solution to optimize Operations & Maintenance in thermal power plants. Empower fossil fuel power plants for smooth sailing of digital transformation journey.
Hightopo seasoned with decades of experience in the energy industry, collaborated with various big-name companies, has become the first-tired of data visualization solution provider.


 The light-weight web-based solution requires no plugins or downloads, it just works seamlessly on any modern browser & device.